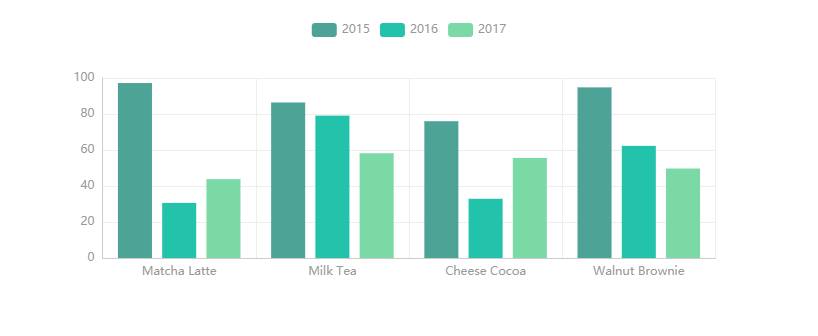
ECharts 的 Vue.js 组件。基于 ECharts
v4.1.0+ 开发,依赖 Vue.jsv2.2.6+。
官网入口:https://ecomfe.github.io/vue-echarts/demo/
Github入口:https://github.com/ecomfe/vue-echarts
安装
npm(推荐方式)
npm install echarts vue-echartsCDN
在 HTML 文件按如下方式依次引入 echarts 和 vue-echarts:
<script src="https://cdn.jsdelivr.net/npm/echarts@4.1.0/dist/echarts.js"></script>
<script src="https://cdn.jsdelivr.net/npm/vue-echarts@4.0.2"></script>
使用方法
用 npm 与 Vue Loader 基于 ES Module 引入(推荐用法)
import Vue from 'vue'
import ECharts from 'vue-echarts' // 在 webpack 环境下指向 components/ECharts.vue

// 手动引入 ECharts 各模块来减小打包体积
import 'echarts/lib/chart/bar'
import 'echarts/lib/component/tooltip'

// 如果需要配合 ECharts 扩展使用,只需要直接引入扩展包即可
// 以 ECharts-GL 为例:
// 需要安装依赖:npm install --save echarts-gl,并添加如下引用
import 'echarts-gl'

// 注册组件后即可使用
Vue.component('v-chart', ECharts)
调用组件
<template>
<v-chart :options="polar"/>
</template>

<style>
/**
 * 默认尺寸为 600px×400px,如果想让图表响应尺寸变化,可以像下面这样
 * 把尺寸设为百分比值(同时请记得为容器设置尺寸)。
 */
.echarts {
  width: 100%;
  height: 100%;
}
</style>

<script>
import ECharts from 'vue-echarts'
import 'echarts/lib/chart/line'
import 'echarts/lib/component/polar'

export default {
  components: {
    'v-chart': ECharts
  },
  data () {
    let data = []

    for (let i = 0; i <= 360; i++) {
        let t = i / 180 * Math.PI
        let r = Math.sin(2 * t) * Math.cos(2 * t)
        data.push([r, i])
    }

    return {
      polar: {
        title: {
          text: '极坐标双数值轴'
        },
        legend: {
          data: ['line']
        },
        polar: {
          center: ['50%', '54%']
        },
        tooltip: {
          trigger: 'axis',
          axisPointer: {
            type: 'cross'
          }
        },
        angleAxis: {
          type: 'value',
          startAngle: 0
        },
        radiusAxis: {
          min: 0
        },
        series: [
          {
            coordinateSystem: 'polar',
            name: 'line',
            type: 'line',
            showSymbol: false,
            data: data
          }
        ],
        animationDuration: 2000
      }
    }
  }
}
</script>